

Background
The Varroa mite is a well-studied ectoparasite that contributes to the destruction of honeybee colonies. It is highly important for beekeepers to monitor levels of Varroa in their colonies so that they can take action to control mite populations at the appropriate time.
Currently, mite monitoring practices require regular apiary visitations, physical inspection of hives, and/or removal of large samples of bees/brood in order to estimate whole colony infestation levels. Yet these disruptive practices could be improved, as Precision Beekeeping is now on the rise. This branch of apicultural management applies remote monitoring techniques, where hive measurements can be recorded using sensors that are left unattended within the colony. This way, beekeepers can be alerted to changes in colony status and the occurrence of important hive events based on these measurements, which then allows appropriate action to be taken only when necessary (Zacepins et al., 2015).
Remotely measuring Varroa levels within colonies is a more recent advancement that is still in its infancy. We propose a novel, remote detection method for mite presence, using accelerometer sensors that measure vibrations. Recently, we set out to identify whether vibrations originating from individual Varroa mites could be captured, and in doing so, discovered a novel mite behaviour that produces a corresponding vibrational trace (Hall et al., 2021). This new behaviour has been termed ‘jolting’, due to the abrupt nature of the body movement produced by the mite. Having characterised the features of this vibration, along with vibrations that are created by mites when they walk, we now have a solid database of known pulses that we can use as a search tool for detecting mites in situ, i.e., within the brood, where Varroa spend half of their life.
The work that has been funded by the Eva Crane Trust supports an investigation into the possibility of detecting Varroa mites within the sealed brood cells using the vibrational data that was collected in our last publication. We aim to detect the vibrations of interest (mite walking and mite jolting) in sections of brood-comb that have been removed from the hive, using accelerometer sensors. We theorise that these specific vibrations will only be captured in brood-comb samples that contain mites, and that they will be absent from samples that lack Varroa. The goal of this work, therefore, is to investigate a novel, remote detection method for mite presence in honeybee capped brood.
An additional aim of this study is to discriminate between mite walking and jolting vibrations so as to determine which behaviour has been captured. In doing so, this work may also contribute to furthering our knowledge on the function of the jolting behaviour, by enabling us to establish whether it occurs within the brood cells.
Our research
Utilising the results from our previous study, we were able to build a training database of known Varroa vibrations (jolting and walking) from recordings where mites were seen to produce the behaviours of interest. The vibrational waveforms of each jolting pulse and walking pulse captured when a mite was placed on a piece of brood-comb (3 x 3cm) were first transformed into spectrograms, and then into Two-dimensional-Fourier-transforms (2DFTs), for seeking out discriminatory features between the two types of vibration. Principal component analysis and discriminant function analysis were undertaken to achieve this.
Despite careful investigation, good discrimination between jolting and walking vibrational pulses could not be achieved at this time (see Figure 1) using spectrograms, on this particular substrate (although it can be done when the substrate is either a petri dish or empty honeycomb). We have considered that it may not be possible to tell the difference between a mite jolting and a mite walking pulse, based on our current investigations.
Through this accelerometer research, and additional video-based experimentation, from our own lab and also kindly supplied to us by Paul Siefert, Goethe-Universität Frankfurt/Main, it appears that Varroa jolting may not occur during the reproductive phase, as it was never identified during observational experiments that mimicked the sealed cell or in experiments with partially transparent cells (Paul Siefert). As a result, we felt confident to move on with our research in an alternative emphasis, focusing on vibrations resulting from mite walking, which has been recorded by ourselves during the observational experiment and is more widely known to occur in the brood-cells (Donzé and Guerin, 1994).
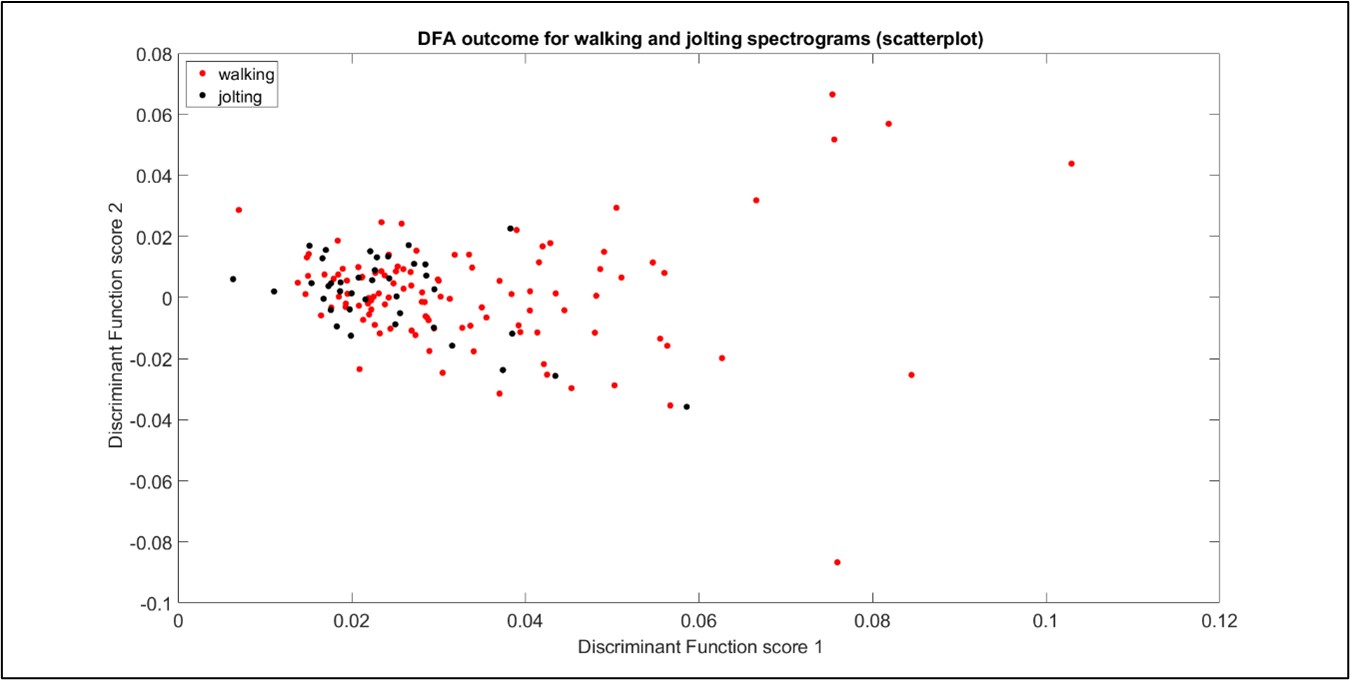

Figure 1: Discriminant function analysis outcome for the collection of Varroa walking and jolting pulses. Here, 7 principal components are included in the analysis. Each point represents one walking (red) or jolting (black) pulse within accelerometer data windows of 0.018 seconds. A lack of discrimination between the two clusters can be seen.
Our original research objective was updated to make best use of our initial results: discriminate between mite walking vibrations and honeybee emergence vibrations in samples of capped brood-comb. This will still allow progress towards the Varroa detection with accelerometer hardware, even if it does not inform the user on the Varroa’s specific activity.
Brood-comb sample recordings regularly demonstrated honeybee related vibrations, confirmed when a bee was seen to emerge from her cell in one such recording. It is critical to be able to identify and pull-out mite vibrations from bee vibrations for successful detection of mites in brood-comb samples. Our theory that brood-comb samples that contain mites will contain vibrations that share the same features as walking pulses, and brood-comb samples that are absent of mites will lack these, remains the same. The important first step in this research is to train the software to identify the differences between bee and mite vibrations so that this theory can be tested.
Due to the very low Signal to Noise Ratio inherent to all our recordings, we proceeded in trying to cluster three categories of vibrational waveforms: those of mite walking, bee emergence and background noise (as background noise was also present in all recordings). In trying to establish a feature reliably specific to these, we eventually found that the 2DFTs for each group exhibited highly characteristic features, showing excellent promise for discrimination (see Figure 2). Following principal component and discriminant function analyses, the three groups of selected signals (i.e. during ‘training’ of the software) clustered well, demonstrating that mite walking vibrations can be discriminated from honeybee vibrations when in the capped brood cells (see Figure 3). Upon projecting the full length of our recordings (‘testing’ of the machine learning) onto the same DF space, we also found that the data systematically collapsed onto the correct category.
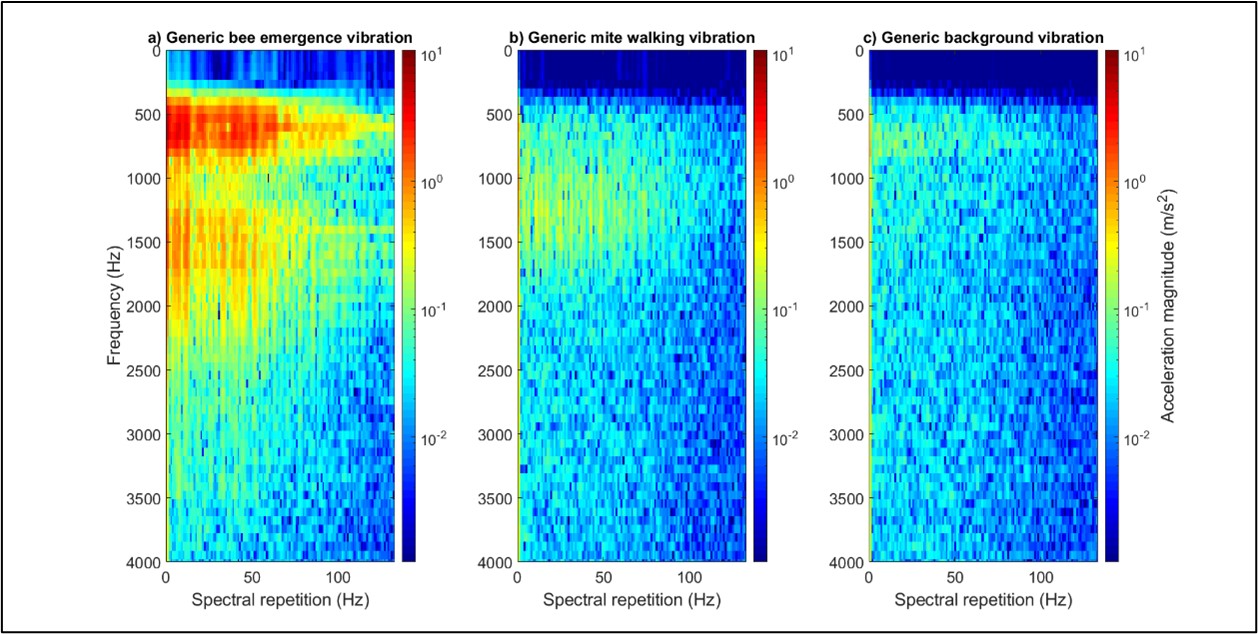

Figure 2: One-second-long extracts of bee (panel ‘a’), mite (panel ‘b’) and background (panel ‘c’) vibrations, viewed as 2DFTs. The differences between the three types of signals can be seen here. All accelerometer data has been high pass filtered (500 Hz) to reduce the impact of background vibrations on the clarity of the mite traces in particular. No traces of interest were identified beyond 3500 Hz. Magnitude of acceleration is in logarithmic (to the base 10), where dark red is the maximum (10.6 m/s2), and dark blue is the minimum (1/10000th of the maximum). All three panels have been scaled identically.

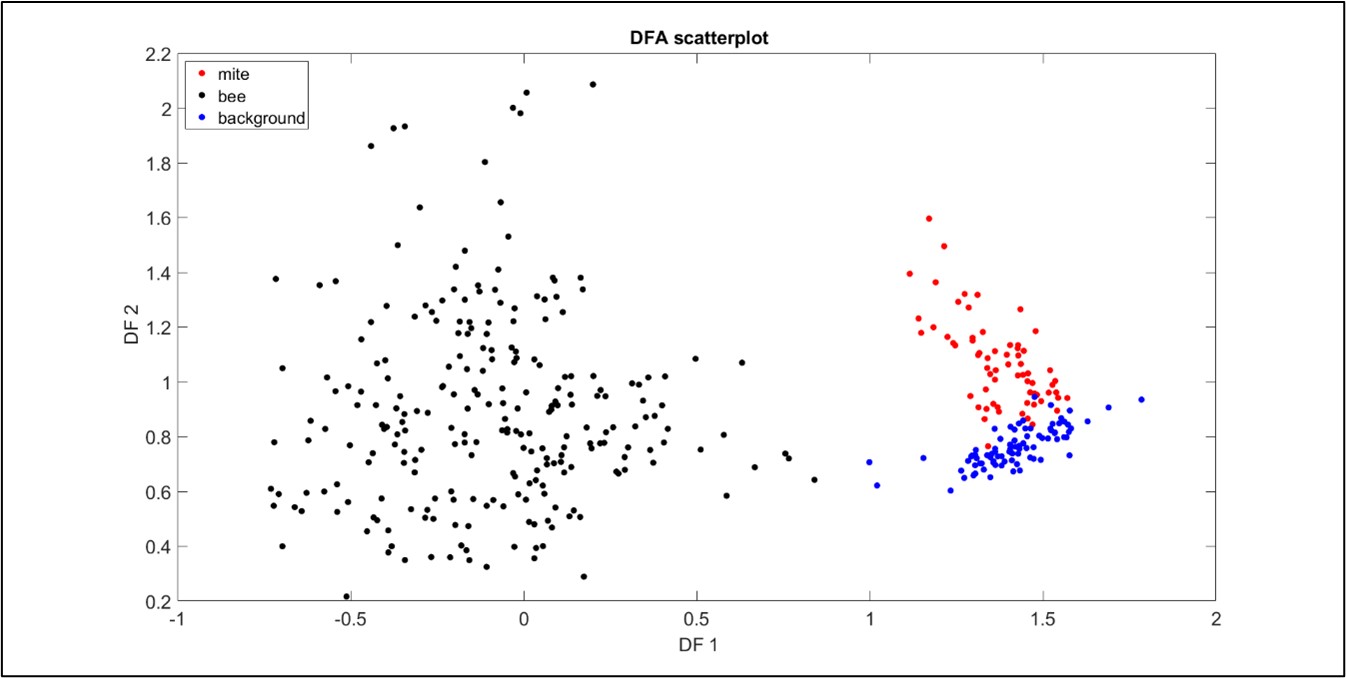
Figure 3: A plot to demonstrate the scattering of the bee, mite and background data in DF space. All three data types exhibit good clustering, with some negligible overlap of the mite and background signals. Each point originates from honeybee-driven (black), Varroa-driven (red) vibrations, or from background (blue) vibration, where one second of accelerometer data has been transformed into a suitable 2DFT.
These results are promising for future mite detection in brood-comb, as the software can identify vibrational features that are specific to a mite and those that are specific to a bee. This also demonstrates that the gait of a Varroa has a unique vibrational signature that is identifiable by our software, an exciting, novel bioacoustics finding.
We have tested this training database with long-term accelerometer recordings taken from capped brood-comb specimens that, i) were absent of Varroa, ii) contained Varroa (ranging from 1 individual up to 6 individuals). The results of this next stage of analyses is disappointing, showing substantial overlap between categories, as the vast majority of the data points exhibit such low SNR that they prevent meaningful interpretation. Varroa activity in capped brood cells probably results in weaker vibrational pulses than we have measured so far when the animal is in full sight.
We are now in a position to draft a manuscript for peer-reviewed publication, demonstrating that we are the first to detect and identify the specific vibrational trace of a mite walking, and that we can clearly discriminate between this and the vibrations of an emerging honeybee. This research is an important step towards the remote detection of Varroa in honeybee colonies.
Dr. Martin Bencsik and Harriet Hall, Nottingham Trent University, UK
Ref.: ECTA_20210603_Bencsik
Completed: 2022
References
Donzé, G. and Guerin, P.M., 1994. Behavioral attributes and parental care of Varroa mites parasitizing honeybee brood. Behavioral Ecology and Sociobiology, 34(5), pp.305-319.
Hall, H., Bencsik, M., Newton, M.I., Chandler, D., Prince, G. and Dwyer, S., 2021. Varroa destructor mites regularly generate ultra-short, high magnitude vibrational pulses. Entomologia Generalis.
Zacepins, A., Brusbardis, V., Meitalovs, J. and Stalidzans, E., 2015. Challenges in the development of Precision Beekeeping. Biosystems Engineering, 130, pp.60-71.