Crowdsourcing honey bee waggle dance data to map the temporospatial distribution of forage availability
Crowdsourcing honey bee waggle dance data to map the temporospatial distribution of forage availability
Background
The role of pollinators in maintaining agricultural output and global biodiversity is well understood, with 88% of flowering plants and 75% of crops dependent on animal pollination to varying degrees1,2. However, there remain ongoing concerns regarding the long-term decline of both wild and managed pollinators3,4. While many potential causes have been identified, the prevailing consensus is that decreasing floral resources in the landscape is key5,6,7.
Due to the difficulty of quantifying nectar resources, and the spatial, temporal and interspecies variability of flowering plants, direct assessment of landscape quality for pollinators is extremely labour-intensive8,9,10. Hence, we currently lack an efficient and cost-effective research tool capable of quantifying landscape scale floral resource availability. As such, our understanding of the features, habitats, resource continity and management techniques required to rehabilitate and maintian healthy pollinator landscapes is confined to local case studies11,12 and research that relies on complex extrapolation9.
The honey bee (Apis mellifera) has consistently proven to be an excellent biological indicator for a range of applications, from heavy metal and pesticide pollution13,14 through to SARS-CoV-2 occurrence and ecosystem function15,16. Because honey bee colonies are highly generalist17, forage across a large areas (potentially >300km2) and continually scout the local landscape for resources, they have the potential to be utilised as indicators of landscape forage availability18.
Honey bees also possess a unique and sophisticated behaviour. Upon returning from a successful foraging trip, they communicate to their nestmates the distance and direction to the rewarding resource via the waggle dance. This vector information can be decoded by eavesdropping researchers as a tool for ecology. By decoding many dances, a map of where the colony, as a whole, is foraging can be constructed. Importantly, foragers only dance for profitable resources, which means that, on average, observed dances signal the “best” forage available at any given time. Honey bees are highly adept economic foragers and will not forage at long distances unnecessarily19,20. Hence, the distance indicated by waggle dances can be used as a measure of the floral resources available in a landscape.
However, decoding waggle dances is very time consuming21. Traditionally, dances are recorded from observation hives and are analysed by hand. Intriguingly, waggle dancers also produce a pulsed sound of approximately 200Hz. The duration and number of these pulses have been shown to be highly correlated to the distance of the food source indicated22. Advances in acoustic signal processing and machine learning, together with the advent of low-cost acoustic monitoring devices, raise the intriguing prospect of automating the recording of the distance component of the waggle dance from full-sized domestic honey bee colonies en masse.
Methodology
Our objectives were to: (i) test the feasibility of deciphering individual waggle dances from acoustic recordings, and to (ii) compare data generated by traditional and automated waggle dance decoding techniques. This was achieved by gathering data from three observation hives, with waggle dances being recorded both visually and acoustically.
Video recordings were manually decoded following the protocol developed of Couvillon et al.23. Acoustic recording were conducted via a variety of microphones, from high-quality studio microphones to digital MEMS units, as you would find in a mobile phone. These recordings were visualised via spectrographs and variety of smoothing, windowing (e.g. Hamming, Bartlett, Kaiser, and Blackman) and filtering techniques will be tested for their efficacy at reducing background noise, removing unwanted frequencies, and isolating the waggle dance signal.
Results
We tested several designs of honey bee observation hives to allow very close access to waggle dancing bees. The best results were obtained from a hive in which we restricted the bees to one side of the frames. This ensured we could observe all waggle dances taking place within the hive and we could place a microphone at the rear of frames.
The amplitude of the signal is much weaker than we had originally anticipated. However, the clearest results were obtained from electret capsule microphones (Primo EM283 Figure of Eight bi-directional electret capsule). The Spectrogram Matlab function, which returns the Short-Time Fourier Transform of the input signal, was use to visualise the acoustic output. The spectral centroid downshift method was used to isolate the waggle dance acoustic signal. The frequency spectrum of the original signal indicated the fundamental frequency of the waggle dance is approximately 238 Hz. Therefore, filters were used with a passband frequency range that displayed the fundamental frequency at the center of the range. A good agreement was found between the time duration of the acoustic pulses with the manually decoded duration of the waggle dances (see Fig. 1).
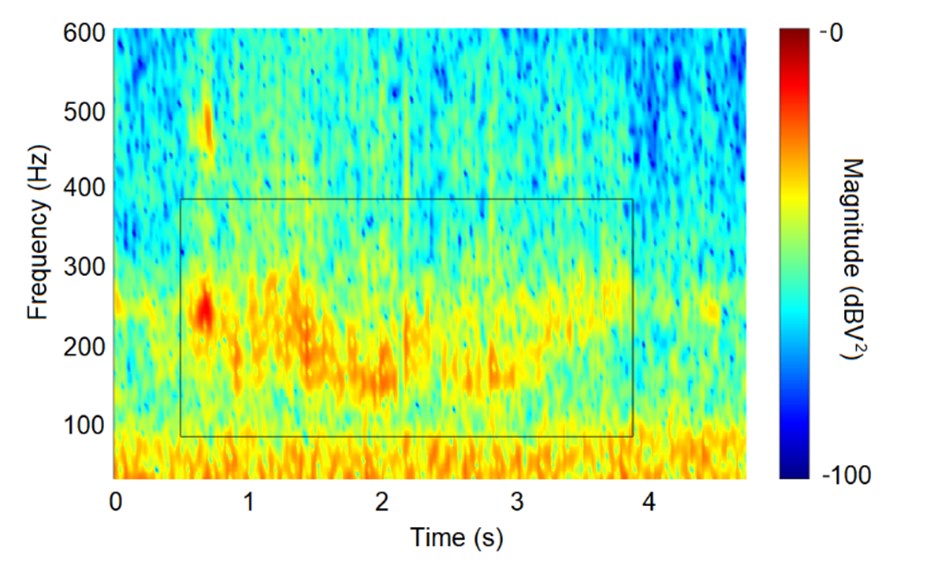
Fig. 1 Spectrogram of a waggle dance run captured by a capsule microphone and waggle dance run duration manually decoded from a video recording (black rectangle).
Future Directions
Now that we have characterised the waggle signal we plan to develop time- and frequency-resolution analysis techniques to automate the detection process. We are currently planning on using Machine Learning models to automatically detect and decode waggle dances. This analysis will take a convolutional neural network approach. Using a ResNet-18 infrastructure pre-trained on the acoustic library AudioSet24, we will develop a binary classification algorithm (i.e. “waggle dance absent” vs. “waggle dance present”) that will allow us to isolate dance events.
Further work is also required to optimise: (i) models with varying receptive fields, with the aim of reducing the cost, size and power requirements of the hardware while maintaining high audio quality; (ii) power supplies and data storage options to determine the optimum solution for both cost-effectiveness and sampling duration; (iii) the potential use of acoustic metamaterials to manipulate the sound waves within a honey bee colony and isolate the waggle dance pulse frequency; (iv) casing materials (e.g. beeswax, metal mesh, plastic frame foundation) suitability for soundwave penetration and compatibility with honey bee hive activity; and (v) the graphical user interface.
Dr. Nicholas J Balfour
School of Life Sciences
Univeristy of Sussex, UK.
Ref. ECTA_20201209
References
1. Klein, A.M. et al., 2007. Proc. Natl. Acad. Sci. 274:303-313.
2. Ollerton, J., Winfree, R., & Tarrant, S. 2011. Oikos 120:321-326.
3. Neumann, P., and Carreck, N.L., 2010. J Apic. Res. 49:1-6.
4. Soroye, P., Newbold, T. & Kerr, J., 2020. Science, 367: 685-688.
5. Balfour, N.J et al., 2018. Biol. Conserv. 222:278-283
6. Goulson, D. et al., 2015. Science, 347, 1255957.
7. Ollerton, J. et al., 2014. 346:1360-1362.
8. Garbuzov, M., Balfour, N.J. et al., 2020. Insect Conserv. Divers. 13:532-542.
9. Baude, M. et al., 2016. Nature, 530:85-88.
10. Hicks, D.M., et al., 2016. PloS one, 11:e0158117
11. Timberlake, T.P., Vaughan, I.P. & Memmott, J., 2019. J. Appl. Ecol. 56:1585-1596.
12. Balfour, N.J., et al., 2015. Agri. Eco. Environ. 213:265-271.
13. Bargańska, Ż., Ślebioda, M. and Namieśnik, J., 2016. Environ. Sci. Technol., 46:235-248.
14. Ponce-Vejar, G., et al., 2022. Int. J. Environ. Res. Public Health, 19:8199.
15. Cilia, G. et al., 2022. Sci. Total Environ. 150327.
16. Quigley, T.P., Amdam, G.V. and Harwood, G.H., 2019. Curr. Opin. Insect. Sci. 35:132-137.
17. Balfour, N.J. et al., Ecology. e3801
18. Couvillon, M.J. and Ratnieks, F.L., 2015. Front. Ecol. Evol, 3:44.
19. von Frisch, K. 1967. The Dance Language and Orientation of Bees. Harvard University Press.
20. Seeley, T. D. 1994. Behav. Ecol. Sociobiol. 34:51–62.
21. Balfour, N.J. and Ratnieks, F.L., 2017. Agric. For. Entomol. 19:210-216.
22. Wenner, A.M., 1962. Anim. Behav. 10:79-95.
23. Couvillon, M.J. et al., 2012. Biology Open, 1:467-472.
24. Google Research. 2023. AudioSet, A sound vocabulary and dataset.