
Healthy diet, healthy guts, healthy bees.
Healthy diet, healthy guts, healthy bees.
Executive Summary:
We have successfully sequenced the pollen DNA extracted from honey samples taken from across the north west of England. Analysis of the DNA sequence data has allowed us to reveal the plants which constitute the forage of the bees from each hive. We have also used GIS analysis to measure the types of land use surrounding each hive. By combining these two novel datasets with wing fluctuating asymmetry data we have been able to show an important significant inverse relationship between diversity of plants in the forage and developmental stress at the level of the hive. We have also shown the absence of a significant correlation between diversity of land use and diversity of diet.
Project Outline:
A varied diet of pollen and nectar collected from a broad range of plants is likely to contribute to a greater diversity in the gut microbiome of honeybees. However many hives are located in areas where they may not have access to a broad range of flora. A healthy (diverse) gut microbiome is known to have benefits for the overall health of bees including protection against parasites and insecticides and is likely influenced by their diet, which in turn is influenced by the land use and plant availability in the surrounding area. A powerful measure of developmental stress in a hive is the fluctuating asymmetry of individual insects which increases as hive stress levels increase.
By using DNA metabarcoding to describe the pollen communities in honey samples collected from 61 hives across the North-West of England, we proposed to investigate the influence of land use surrounding a hive on the diversity on the diet and gut microbiome and the related influence on the overall health of individual bees.
Summary of Outcomes
The data generation processes for this project are now complete and data exploration, statistical analysis and writing is underway. We have identified several interesting and important trends in the datasets and will be continuing to write up the work over the coming months and produce the anticipated outputs. The production of this final report closes the research phase of this project and we will ensure to send updates on research outputs (research papers, conference presentations, blog posts) as they are completed.
The laboratory molecular work has been completed, as has the bioinformatics analysis of the raw DNA data, allowing us to generate plant community lists for each of 61 honey samples. The DNA sequence data totalling 33 gigabases has been deposited in the public DNA sequence databases, and computer scripts detailing analysis in public code repositories, although both are currently under embargo until reports and papers have been published.
The GIS analysis of the land surrounding each hive has been completed, bringing us to the point where the four raw datasets comprising this research project have been generated and collated (diet, gut microbiome, land use, and fluctuating asymmetry). Statistical analysis has been performed relating to the diet, land use and fluctuating asymmetry with the next analytical stages set to also incorporate the gut microbiome data.
Summary of Laboratory Work:
During 2021 we have performed the laboratory work relating to the DNA extraction, PCR amplification and sequencing of the pollen from honey samples (Figure 1).
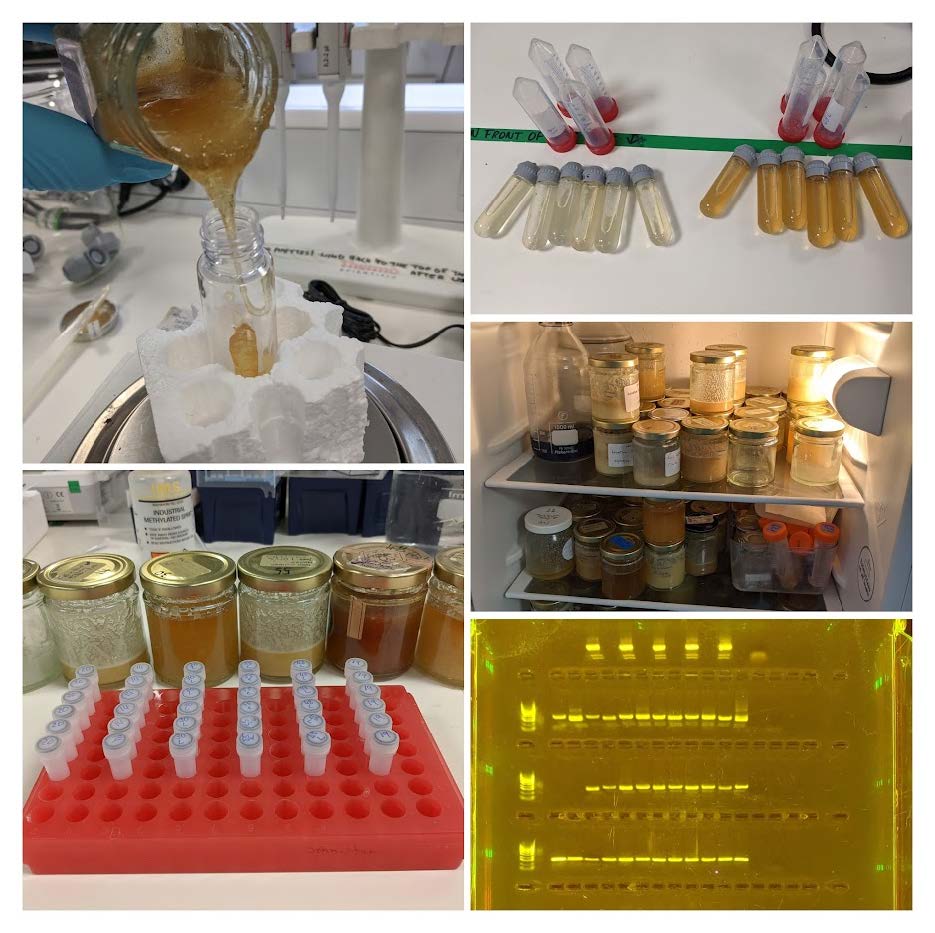
Figure 1. Photographs from top left, going clockwise: decanting honey into a reinforced centrifuge tube in the lab, two diluted honeys in tubes ready for centrifugation (showing distinct colour variation), a bank of honey samples in cold storage, PCR products fluorescing on an agarose electrophoresis gel demonstrating successful PCR amplification, a set of honey samples and accompanying set of high-impact resistant tubes used for mechanical disruption of pollen for DNA isolation.
Description of laboratory processes employed to analyse DNA isolated from honey:
1) Pollen isolation from raw honey
a) Honey sampled (40g) in clean DNA-free UV hood
b) Diluted in high purity DNA-free H2O
c) Centrifugation at 16,000 x g
d) Removal of sugar supernatant
2) DNA extraction of plant DNA from mixed pollen
a) Pollen disrupted using high velocity mechanical tissue homogeniser
b) DNA extracted in DNA-free UV hood using Qiagen DNeasy Plant Mini kits
3) Amplification of plant metabarcoding markers
a) Two plant metabarcoding genomic regions amplified by PCR (rbcL and ITS2)
b) Amplifications performed in triplicate to reduce stochastic effects
4) DNA Sequencing
a) Two DNA libraries (one rbcL, one ITS2) sequenced using Illumina MiSeq V3 technology at Manchester Metropolitan University
Summary of GIS and DNA Sequence Data Analysis
The DNA sequence data were processed using the ‘dada2’ workflow for filtering, and denoising data of this type in the R statistical platform. Lists of plant taxa detected in each honey sample were then determined by comparison of processed DNA sequences with curated databases of known sequences.
Land-use data covering the UK were downloaded from the UK Centre for Ecology & Hydrology and imported into the QGIS software package. Circular concentric buffers were drawn around the location of each hive based around the typical foraging distance of A. mellifera (maximum buffer of 5000m radius). The LECOS plugin for calculating landscape ecology statistics was then used to calculate the proportions of each of 21 types of land use in each buffer.
Results
In total, 389 unique taxonomic units were identified, of which 162 plant species in 134 plant genera were detected. Shannon’s diversity index of the plant communities ranged from 0.13 to 2.92 (Figure 2). The most common plant taxa found in honey samples were Impatiens glandulifera, Quercus spp., Brassica spp., and Sorbus spp.
Statistical analysis of the data have revealed significant correlations between wing fluctuating asymmetry scores and the diversity of the pollen in the diet, indicating that a “healthy” diverse plant diet influences the overall health of individual bees by reducing developmental stress in the hive.
Regarding the influence of the types and proportions of each type of land use surrounding a hive, there is no apparent relationship between the diversity of land use and the diversity of plants in the diet. Similarly we do not see any relationship between the proportions of any particular type of land use and the diversity of diet.
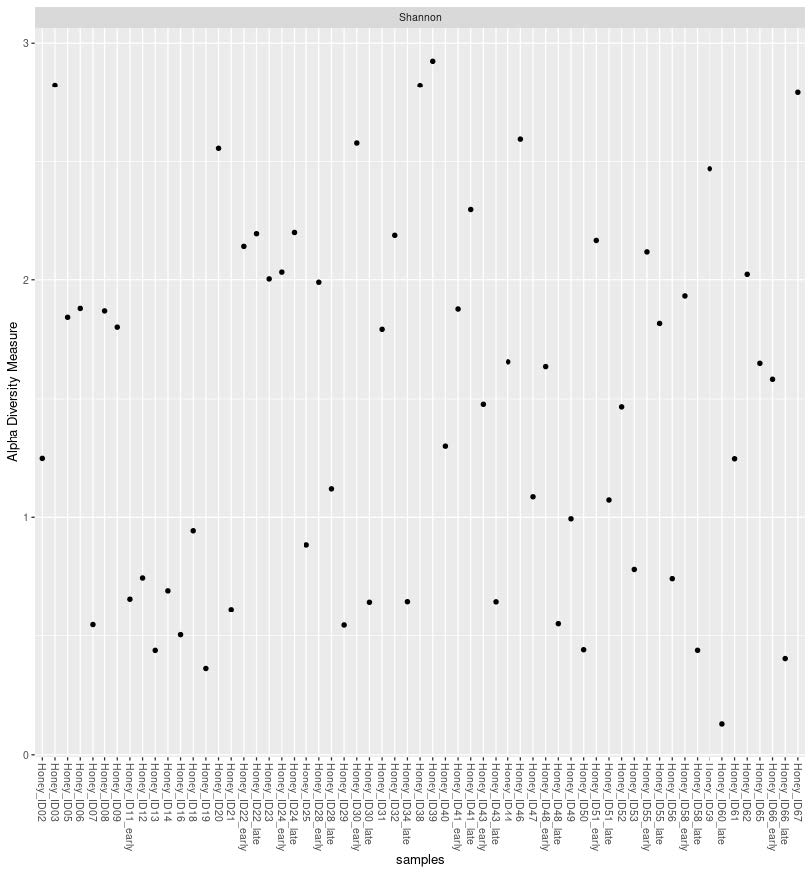
Figure 2. Alpha diversity (Shannon) of the plant communities detected in honey samples through DNA sequencing and metabarcoding.
Conclusion and Next Steps
Isolation of the DNA from pollen in honey and subsequent metabarcoding has been shown to be a powerful technique to describe the plant community foraged by the bees of a hive. We have identified a potential relationship between diet diversity and developmental stress and will go on to assess whether the structure or diversity of the gut microbiome also plays a role. There is further analytical work to perform to evaluate whether particular diet components or particular members of the gut microbiome overtly influence the health of developing bees and whether plant forage diversity is the key factor.
Graeme Fox & Jennifer Rowntree
(Formerly of Manchester Metropolitan University, when funding was awarded)