
Decoding Audio-Visual Honeybee Hive Signals For Waggle Dance Detection And Hive Health Monitoring
Decoding Audio-Visual Honeybee Hive Signals For Waggle Dance Detection And Hive Health Monitoring
Milestone 1
The goal of Milestone 1 was to develop a colony observation module that can be incorporated into a standard Langstroth honeybee colony. The colony observation module must be able to film a representative subset of the waggle dances performed by foraging bees in the colony. It must also be able to monitor the auditory signals produced by the colony.
Design of this module was done using the 3D design website (http://www.tinkercad.com). The module consists of a camera box facing parallel to the bottom frames of a Langstroth hive (Figure 1). A 120 frames per second (fps) camera (Figure 1ab, 1) is positioned in the box, facing the outermost frame of the colony (Figure 1ab, 3), which is visible through a perspex sheet (Figure 1ab, 5). The frame is illuminated by 4 LED light strips (Figure 1ab, 4). In order to enter the hive, bees must walk through an entrance tunnel that runs underneath the camera box (Figure 1ab, 2). Returning forager bees are forced by the position of the entrance tunnel to walk over the edge frame of the hive to get further into the colony. This forces the majority of the waggle dances to be performed within the visual field of the camera (Tautz and Lindauer, 1997). A microphone is located above the frames of the bottom level of the hive to record general hive activity signals as well as swarming related signals such as queen piping and tooting (Figure 1ab, 6).
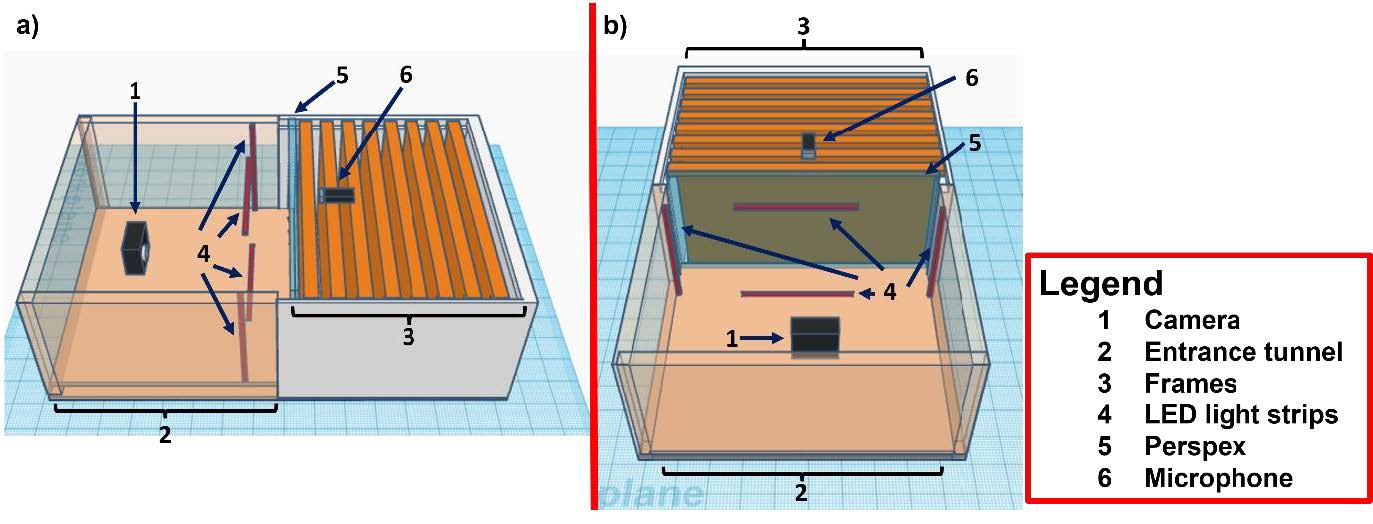
Figure 1: The side (a) and front (b) view of the colony observation model designed using www.tinkercad.com. The camera (1), entrance tunnel (2), frames (3), LED light strips (4), Perspex (5) and microphone (6) have been labelled for clarity.
Six 10-frame observation colonies were built as part of Milestone 1, and were used to collect a preliminary dataset for the waggle dance component aspect of the Milestone 2 (Figure 2). Audio data was also collected to test whether the positioning of the microphones was suitable for colony activity signal detection.
The honeybees quickly adapted to their new box design, covering the visible frame and performing waggle dances within view of the camera (Figure 2a). Colonies were left in their observation hives for at least a week before commencing filming trials for Milestone 2 (Figure 2b).
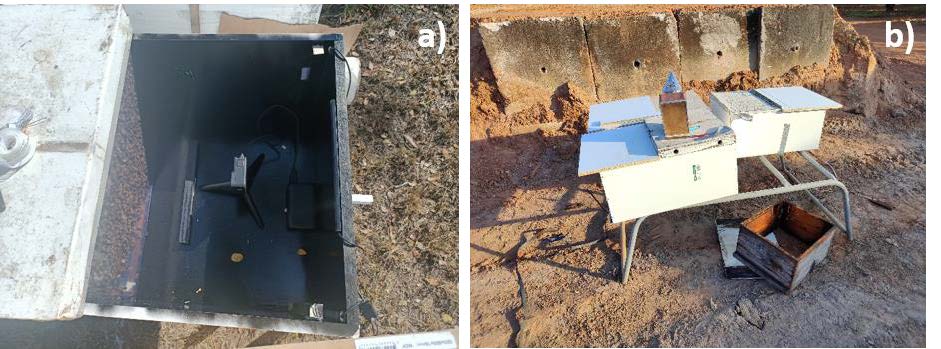
Figure 2: a top (a) and side (b) view of the colony observation module on single story 10 frame Langstroth hives.
Milestone 2
Audio analysis of queen piping signals
Initially, we attempted to collect Apis mellifera queen piping signals to correlate the frequency and intensity of individual queen’s quacking and tooting auditory signals(Michelsen et al., 1986) with whether they successfully mated, and with the health of nucleus hives headed by these queens over the subsequent months. To do so we ordered queen cells from Beeline Beewares, a queen breeder in Lyndhurst, New South Wales. Queen cells were placed in an incubator on Western Sydney University Hawkesbury campus (Figure 3a), and 25 queenless nucleus hives were set up in a field nearby to act as queen hosts (Figure 3b). Our plan was to elicit queen quacking signals from soon to emerge honeybee queens by playing them the vibration cues from queen tooting signals (see Michelsen et al., 1986 for methodology). Upon emergence we would place queens on an observation colony frame with queen cells to induce queen tooting. Once both signals had been recorded for each queen, we would record her morphology and then place her in a mating nuclear colony to record her mating success and subsequent egg laying ability. We hoped both to train our neuromorphic auditory system to Apis mellifera honeybee queen signals, and see whether these signals tell us anything about the reproductive potential of the queens.
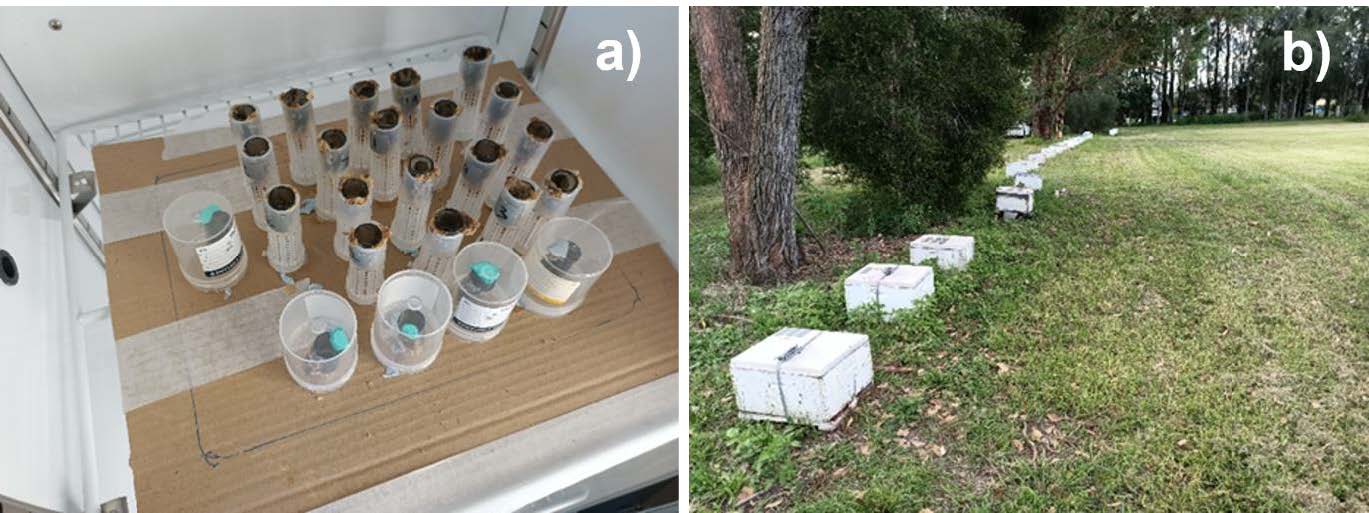
Figure 3: Individually caged queen cells (a) and honeybee colonies (b) located at Western Sydney University, Hawkesbury campus.
As mentioned previously, our plans were disrupted by the 2021 Eastern Australian floods, which cut off our access to the university during the queen incubation period. Due to other fieldwork commitments, James Makinson then had to depart for the Northern Territory to conduct pollination studies on mango, and was unable to rear further queens. We are preparing to rear queens to reattempt this aspect of Milestone 2 with Apis mellifera in March of 2022.
Apis florea queen tooting and quacking
To compensate for the lack of European honeybee queen data, James Makinson recovered some auditory files of red dwarf honeybee (Apis florea) queen quacking and tooting signals that he had obtained during his PhD work in Thailand. This data is a previously unpublished aspect of a study of reproductive swarming behaviour in this species (Makinson et al., 2017).
Red dwarf honeybee (A. florea) bees form single comb colonies that wrap around and hang below small branches (Figure 4). Microphones were located underneath the monitored A. florea colonies, pointing up to the queen cells above. 10 queen emergence and swarming events from 3 separate A. florea colonies were recorded in this fashion.
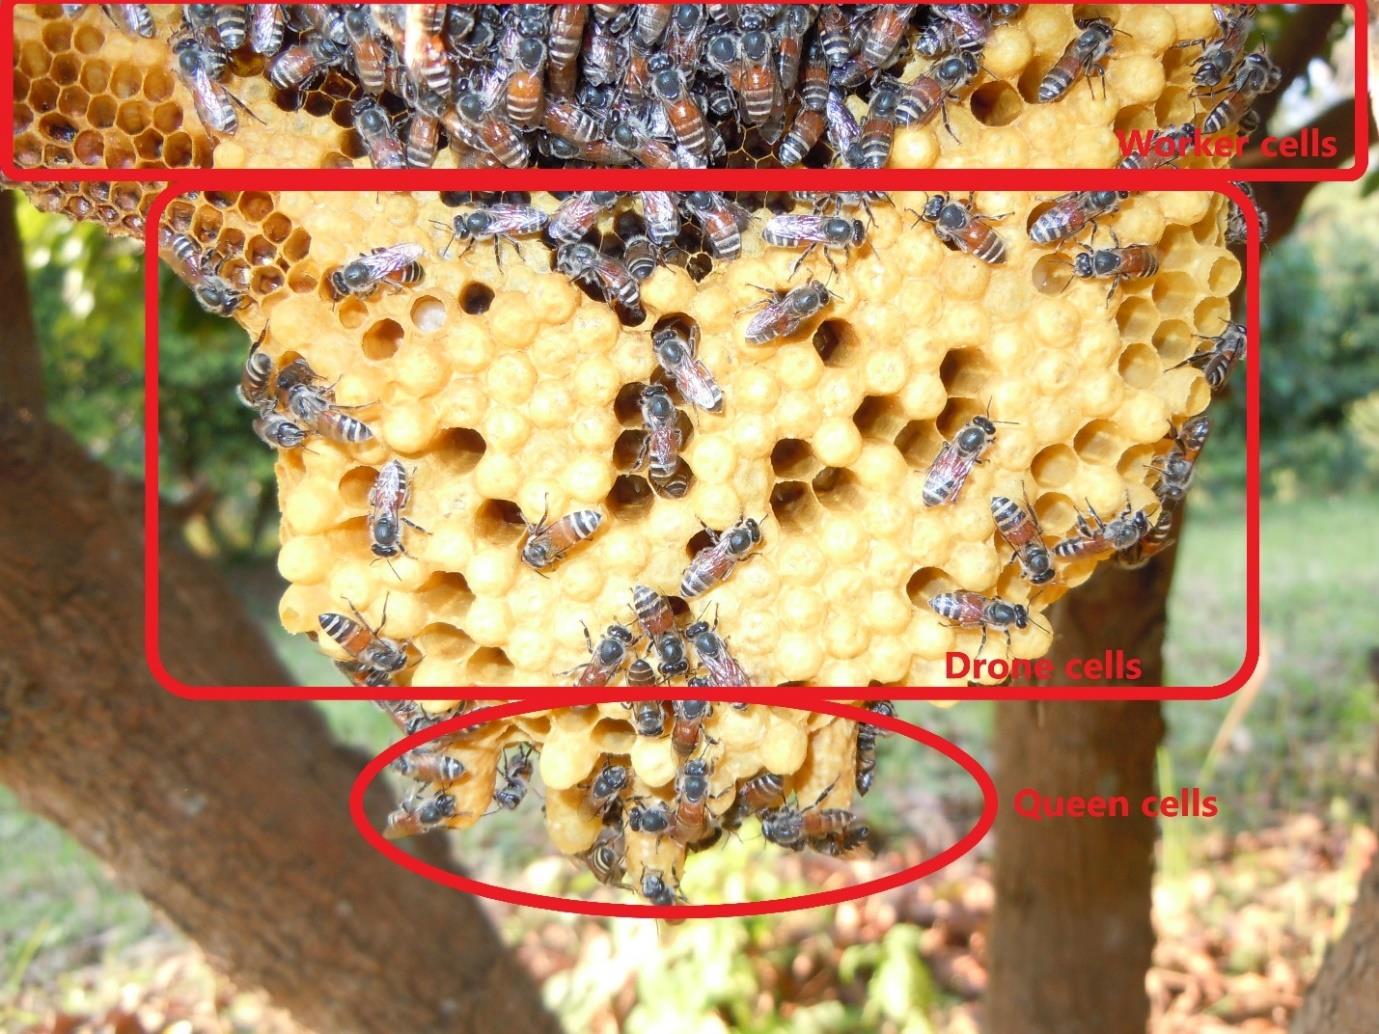
Figure 4: The worker, drone and queen brood sections of a red dwarf honeybee (Apis florea) comb.
Using this data, Ying Xu segregated automatically the tooting and quacking signals of A. florea queen emergence events using a neuromorphic auditory processing approach. The timing of each sound can also be detected, which will be used for investigating how auditory cues correlate with queen vigour and therefore the outcome of queen duels and subsequent swarming events (Tarpy and Mayer, 2009).
Our novel neuromorphic auditory processing approach uses a cochlear model to pre-process input sound. A cascade of asymmetric resonators with fast-acting compression (CARFAC) model is used. The CARFAC model is a digital cascade auditory filter proposed by Lyon (Lyon, 2017) and implemented on hardware by (Xu et al., 2016). It closely approximates the physiological elements of the human cochlea and mimics its qualitative behaviour. The CARFAC exhibits outstanding comparability with biological data recordings with reasonably low computational costs (Saremi et al., 2016). The hardware implementation provides a real-time and low power sound pre-processing platform. Figure 5 shows a 40 second dwarf honeybees recording (Figure 5a) and a cochlear spectrogram (Figure 5b). In the human auditory pathway, information is extracted and conveyed through sequences of actionpotentials, or spikes. The spike streams form robust representations for encoding information sensed in the cochlea and is important for perception. The human sensory system achieves real-time, low- power, and noise robust performance by operating in such an asynchronous “event”-based way. The CARFAC cochlear models auditory nerve fibre functions to transfer the cochlear output into spike trains, as shown in Figure 5c.
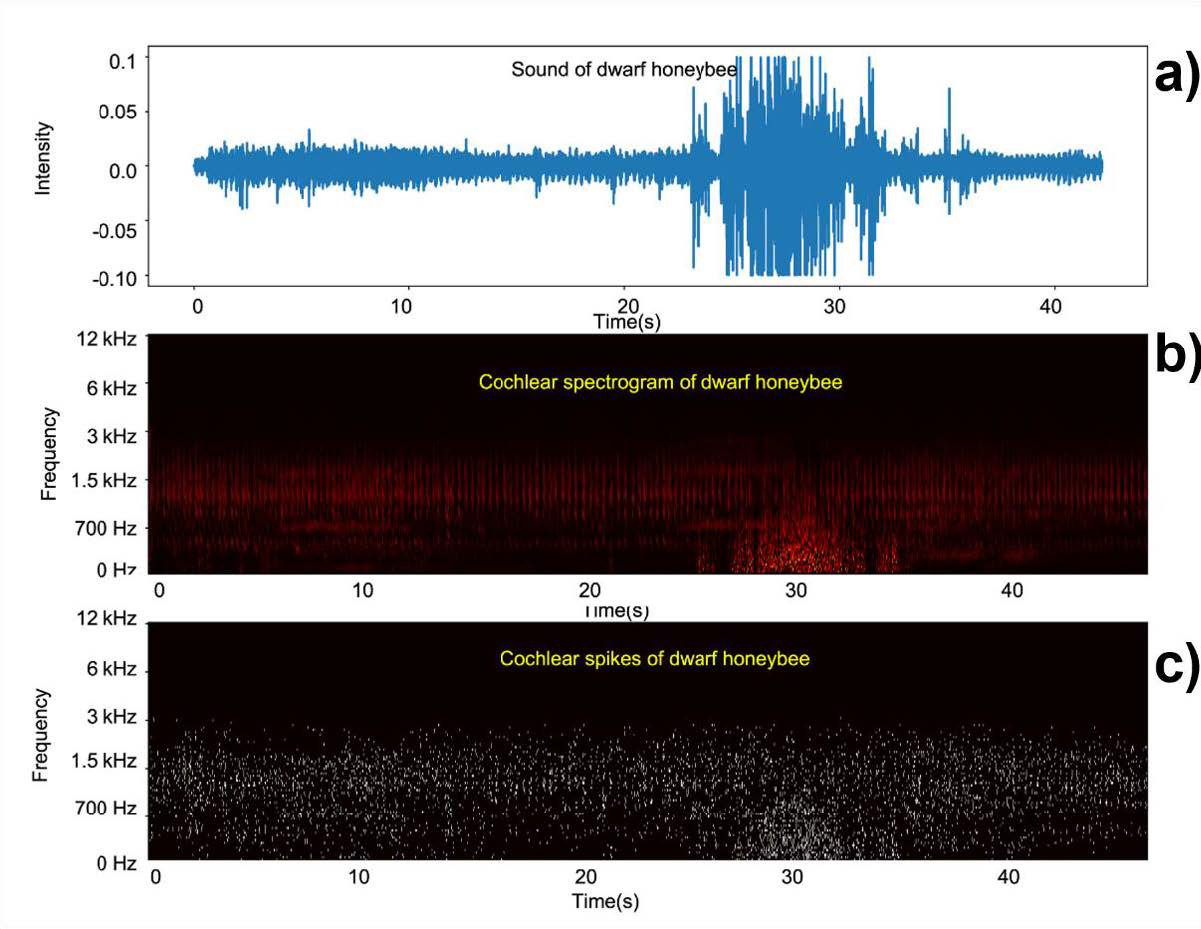
Figure 5: A representative 40 second clip of A. florea queen piping (a), the cochlear spectrogram (b), and spike train output from the CARFAC cochlear model (c).
The spikes are then processed using an event-based unsupervised feature extraction neural network (Afshar et al., 2020). As shown in Figure 6, when an event is sent from the CARFAC output to the feature-detecting neural network, each feature-detecting neuron is able to determine where the event originated and is able to extract features from a local frequency-time region around the event. The neurons of the network compete to determine which one has a receptive field that fits the new event best through an unsupervised adaptive learning process. During learning, a local frequency-time region around the new event (Figure 6a-b) is compared with each receptive field of feature detecting neurons, and a selection threshold for each neuron will be set and adjusted. The neuron, which shows the best match for the new event within its threshold region, is determined as a winning feature detector (Figure 6c-e). The receptive field of thewinning feature (Figure 6d) detector is updated by incorporating the new event, and the selection thresholds of all the neurons will be adjusted accordingly. The winning feature detector then generates an event itself, and these can be connected to the next layer of higher-order feature detectors, where the process is repeated. The algorithm used in this work only has one layer.
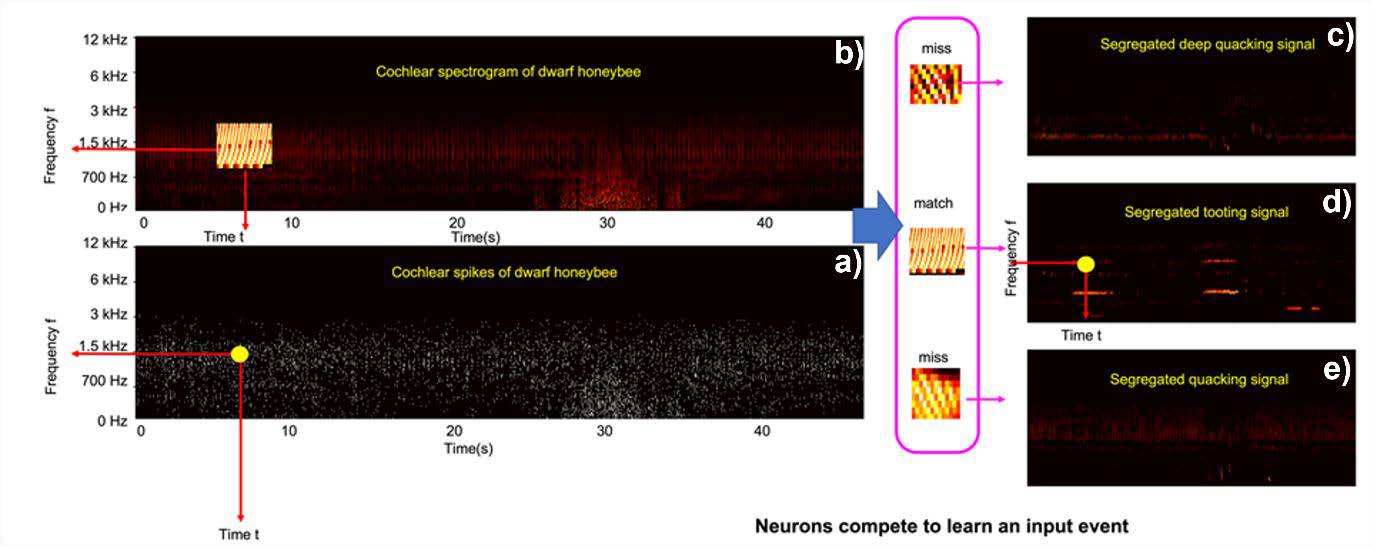
Figure 6: The event-based feature extraction approach segregating different sounds. A spike event is identified (a) and then a local frequency-time region is selected around the event (b). Feature detecting neurons then finds the best match for the region. In this example the match is a queen tooting signal (d), two non-matching signals are shown for illustration (c and e).
After a period of unsupervised learning signals are identified and segregated from the input sound file. Since the event-based approach preserves the temporal information in the work, the onset and offset of each sound can also be detected. Figure 7 depicts a fragment of sound from an A. florea swarming event (Figure 7a), with three separate signals having been identified, both with onset and offset times (Figure 7b-d). As the sound was recorded in an outdoor environment, noise interference is inevitable. In this work, the feature extraction neural network can detect wind mixed in the example recordings, as shown in Figure 7e. The segregation of bee sounds with precise timing information will now be used for investigating how the auditory cues correlation with queen duel outcomes and resulting swarm events.
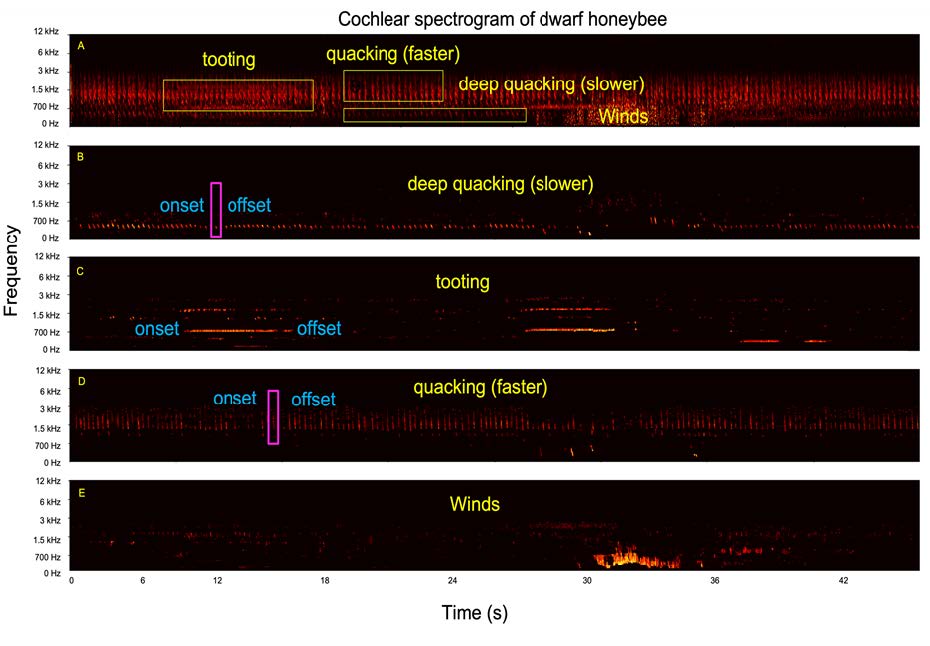
Figure 7: A series of spectrograms depicting segregation of a A. florea sound file using the neuromorphic auditory processing approach. An unprocessed sound file displaying multiple signals (a), ‘deep quacking (slower)’ signals (b), ‘tooting’ signals (c), ‘quacking (faster)’ signals (d) and unwanted wind noises (e).
We successfully have demonstrated here using our python scripts the feasibility of using a neuromorphic auditory processing approach to monitor bee sounds such as queen tooting and quacking. If further funded, we aim to analyse and publish the entire A. florea queen dataset, as well as collect and analyse a new dataset of A. mellifera queen sounds. We will be build a hardware platform for the CARFAC cochlear neuromorphic auditory processing system to allow our monitoring system to work in real time. We are hopeful our system will both detect swarming events before they happen, but also tell the beekeeper about the quality of newly emerging queens.
Video recording waggle dances
In order to test the event-based unsupervised feature extraction neural network (Afshar et al., 2020) with a waggle dance dataset, we placed our 6 observation colonies built as part of Milestone 1 on the edge of a mango farm in the Northern Territory, Australia (Figure 8a). Honeybees from each hive were trained to 2 mol sucrose solution gravity feeders that were initially placed at the hive entrances (Figure 8b). Once at least 20 honey bees from each hive were marked with a POSCA paint pen while feeding at the gravity feeders, all but one feeder was removed, and the remaining feeder was progressively moved further and further from the hives (Figure 8c). 100 foraging honeybees were marked with POSCA paint pens once the gravity feeder reached 50m to ensure we had a large number of foraging bees visiting the feeder. Once we were happy with the visitation rate on the feeder we filmed the waggle dances performed in each of the 6 hives for a 5 minute time interval. We repeated this process of marking and filming at 100m and 200m as well (Figure 8a).
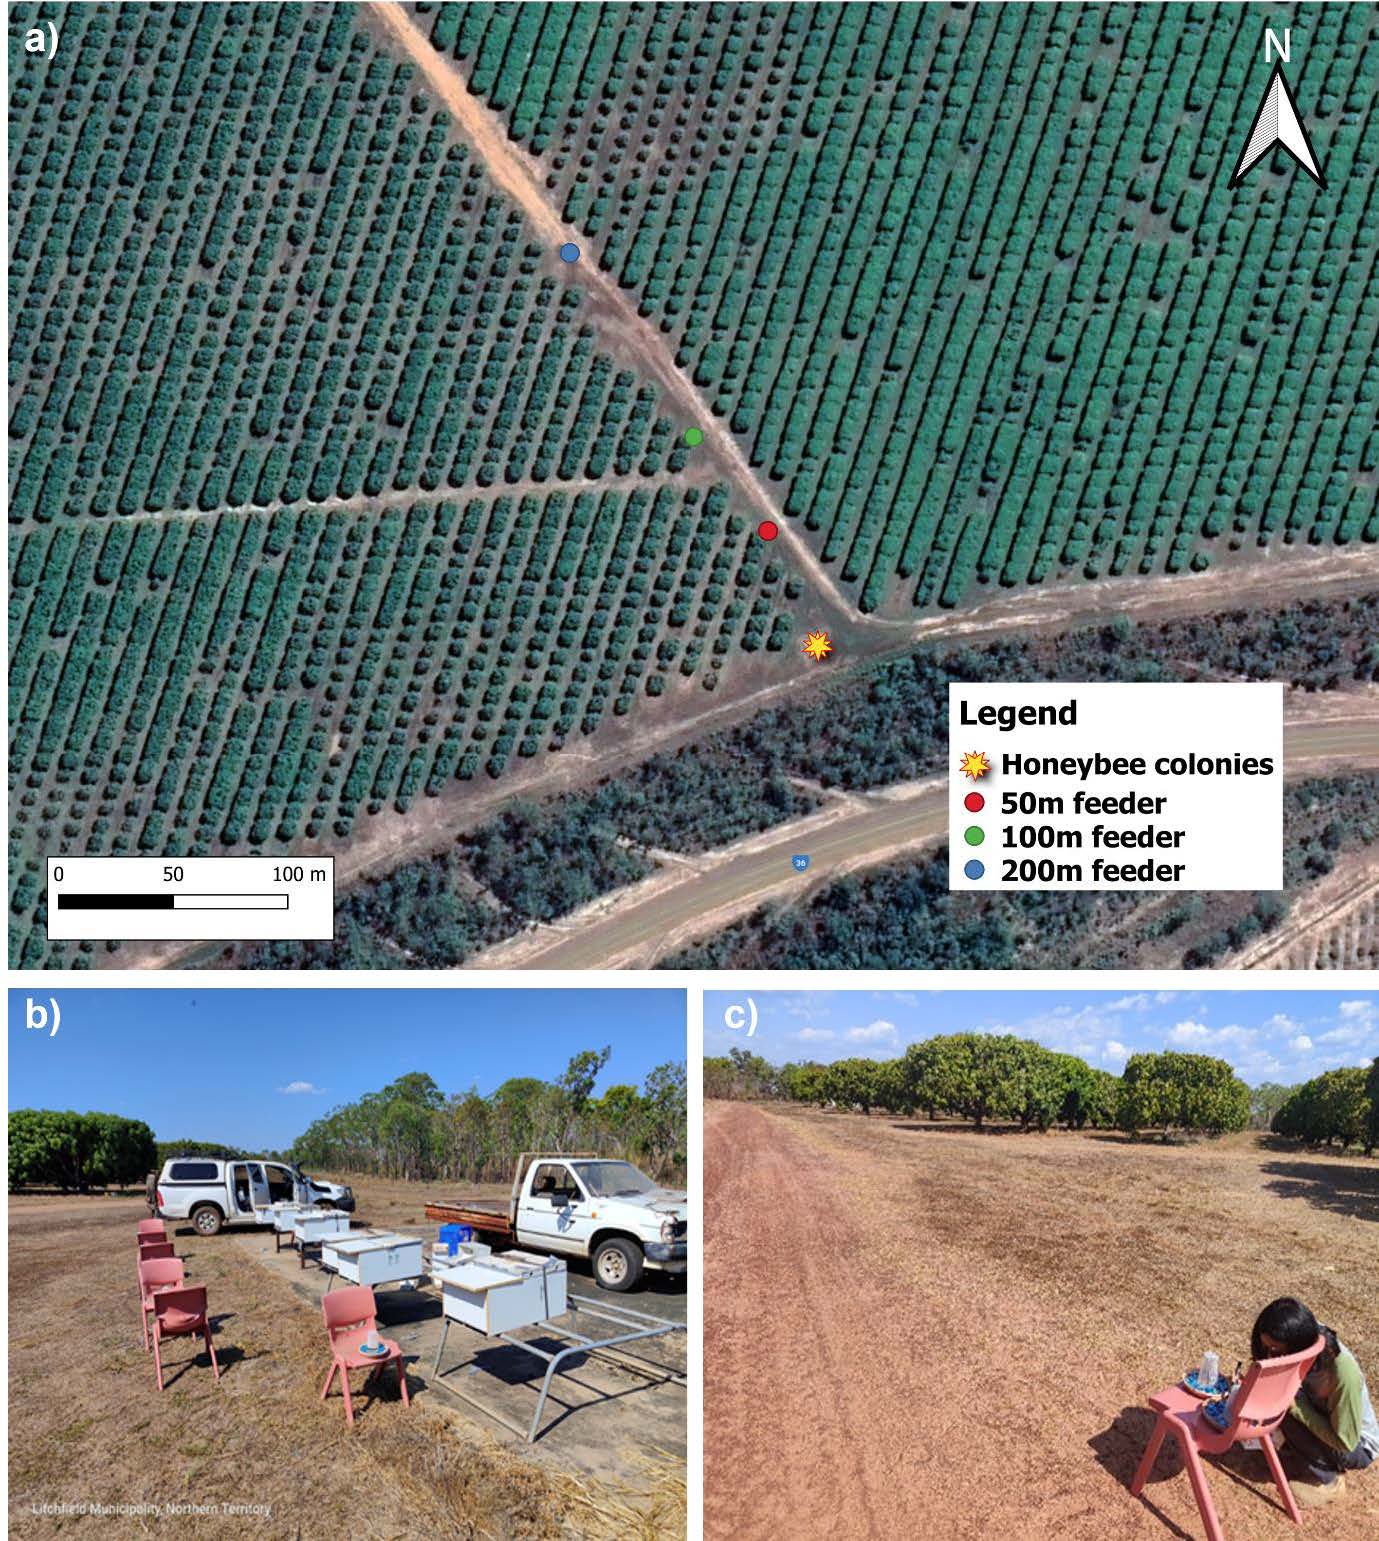
Figure 8: The location of 6 observation colonies (star symbol) at Cheeky Farm mango orchard in Lambells Lagoon, Northern Territory (12°36'27.8"S 131°15'45.3"E) (a). Bees were initially trained to a 2 mol sugar solution gravity feeders located in front of the colonies (b). After this initial pretraining, as single gravity feeder was moved further from the colonies (c). Waggle dances were recorded for approximately 5 minutes at 50 metres distance from the hives (a, red dot) before the feeder was relocated to 100m (a, green dot) and then 200m (a, blue dot).
Waggle dance footage was filmed at 120 frames per second (Figure 9a), after which the fundamental frequency of the waggle dances was detected by Saeed Afshar using a temporal convolution network (Figure 9b). This output was then analysed by the spatio-temporal convolution network (Figure 9c) which identifies the waggle run which can be seen highlighted in Figure 9d. The waggle run sequence identified in Figure 9d is then extracted as a series of x and y coordinates as seen in Figure 9e. This process is further visualised in a video clip that can be found by using the video link in the text of the Figure 9 legend.
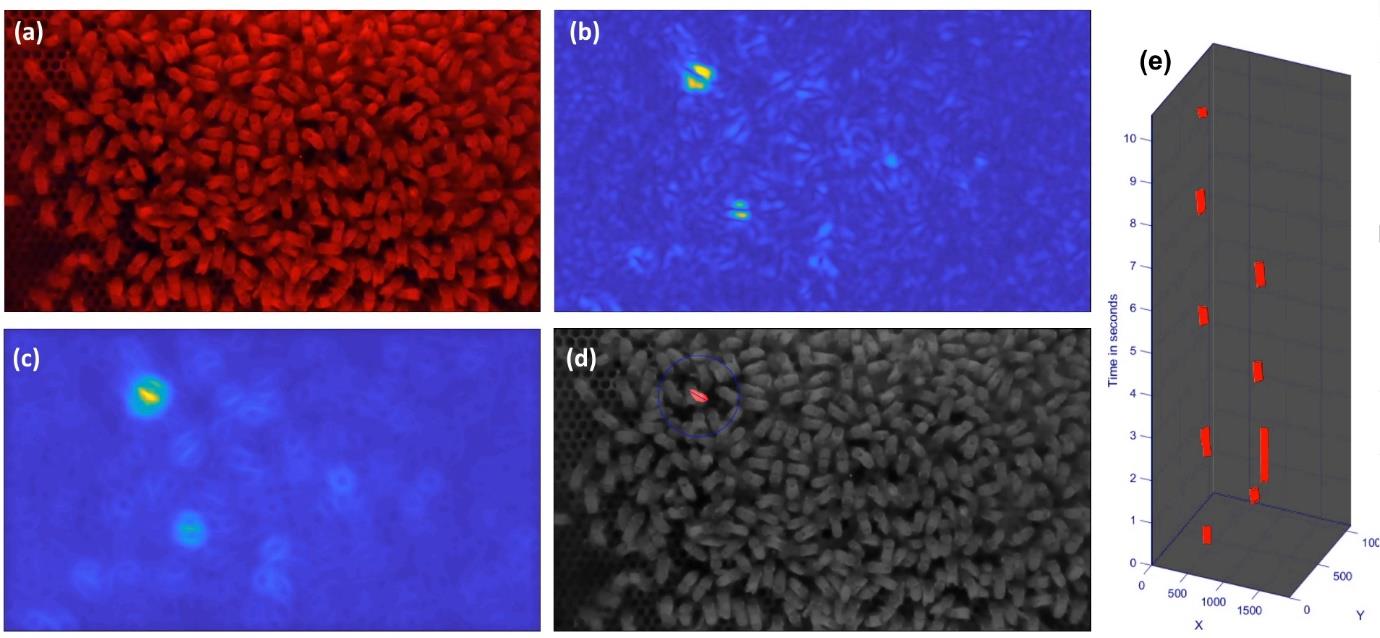
Figure 9: Automated waggle dance detection system. a) shows a still from original video b) shows the corresponding output activation of a temporal convolution network detecting a range of waggle frequency bands. c) shows the output of the spatio- temporal convolutional network operating on b). d) shows the waggle run detection event at the centre of the blue circle with the line indicating the waggle direction. (e) shows a space-time representation of the waggle dance event-stream with the x and y axes indicating the coordinates of the sensor pixels and the vertical axis indicating time. A video demonstration can be viewed at: https://drive.google.com/file/d/1genbgKkoSQaC8Rz4y8qvrgMzgh609GyY/view?usp=sharing
The x and y coordinate series extracted by the automated waggle dance detection system are represented here in Figure 10. A wide range of waggle runs for different locations were detected by our system, but waggle runs recorded while the gravity feeder was at each distance from the hive (50m, 100m and 200m) there is a cluster of waggle runs detected clustered around the know location of the food source.
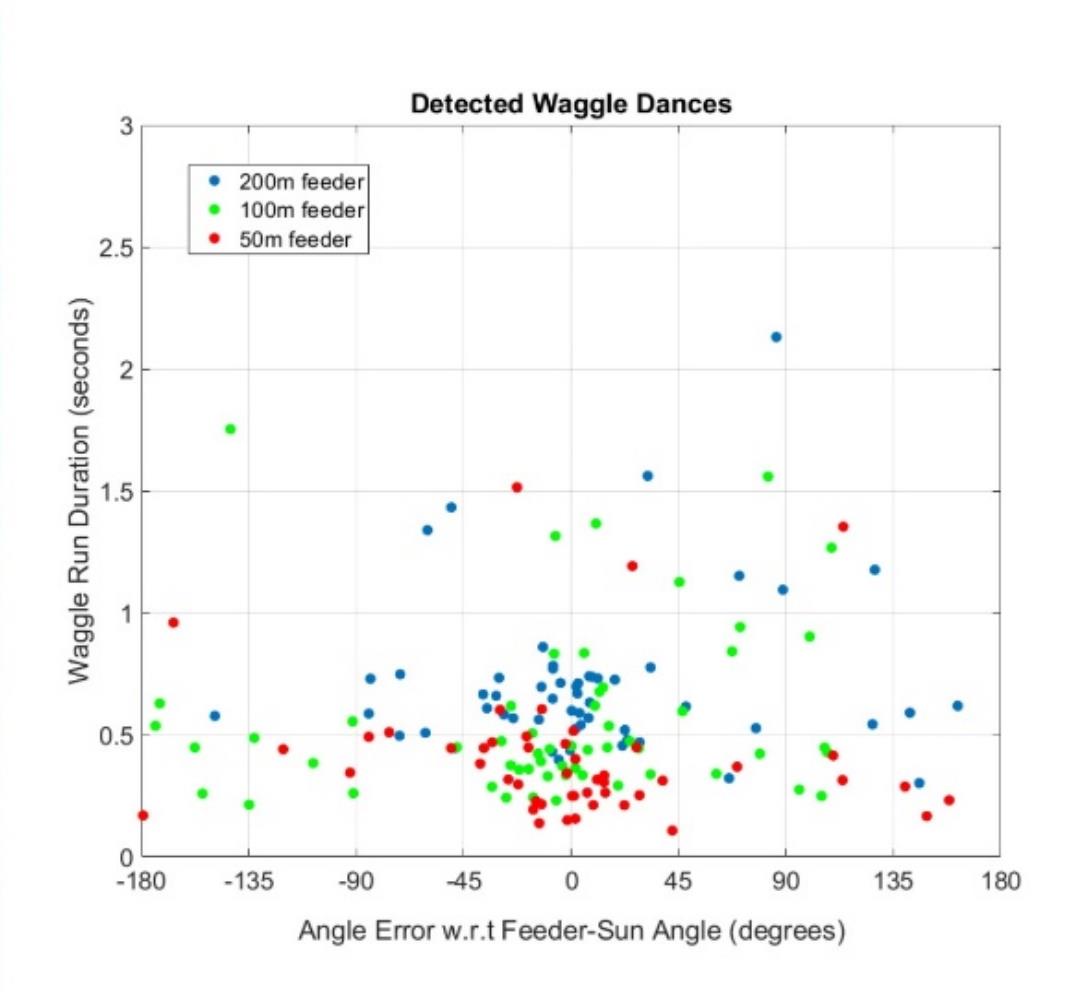
Figure 10: The waggle runs extracted from 6 honey bee colonies dancing while a gravity feeder was located 50m (red dots), 100m (green dots) and 200m (blue dots) from the hives. The x axis indicated the deviation of each waggle run from the direction of the feeder (-180 degrees to +180 degrees), while the y axis indicates the length of each waggle run in seconds. With increasing distance of the food source from the colony, the average waggle run duration per dance increases.
In contrast to manually decoded waggle dance studies using single food sources of known directions and distances, our automated system captured all the waggle dance activity of the hive, including dances for much further away locations in different directions to the goal. This dataset therefore demonstrates the robustness of our system, which when integrated into video recorder hardware, shall allow for real time detection and decoding of honey bee waggle runs. Our system shall be the first to our knowledge that will allow for real time decoding of dances, which will be a revolutionary breakthrough for honeybee keepers wanting to know where their bees are foraging in the surrounding landscape.
James C Makinson1, Ying Xu2, Saeed Afshar2, James Cook1
1 Hawkesbury Institute for the Environment, Western Sydney University, Locked Bag 1797, Penrith, NSW, 2751, Australia
2 The MARCS Institute for Brain, Behaviour and Development, Western Sydney University, Penrith, NSW, 2751, Australia
Acknowledgements
We would like to thank the Eva Crane Trust committee for providing us the funds to conduct this project. We would also like thank Beeline Beewares for providing honeybee queens for the auditory component of this study, and Beescreek Honey for providing honeybee colonies for the waggle dance component.
References
Afshar, S., Ralph, N., Xu, Y., Tapson, J., van Schaik, A., Cohen, G., 2020. Event-based feature extraction using adaptive selection thresholds. Sens. Switz. https://doi.org/10.3390/s20061600
Lyon, R.F., 2017. Human and Machine Hearing -Extracting Meaning from Sound. Cambridge University Press.
Makinson, J.C., Schaerf, T.M., Wagner, N., Oldroyd, B.P., Beekman, M., 2017. Collective decision making in the red dwarf honeybee Apis florea: do the bees simply follow the flowers? Insectes Sociaux 1–10. https://doi.org/10.1007/s00040-017-0577-4
Michelsen, A., Kirchner, W.H., Andersen, B.B., Lindauer, M., 1986. The tooting and quacking vibration signals of honeybee queens: a quantitative analysis. J. Comp. Physiol. A 158, 605–611. https://doi.org/10.1007/BF00603817
Saremi, A., Beutelmann, R., Dietz, M., Ashida, G., Kretzberg, J., Verhulst, S., 2016. A comparative study of seven human cochlear filter models. J. Acoust. Soc. Am. 140, 1618–1634. https://doi.org/10.1121/1.4960486
Tarpy, D.R., Mayer, M.K., 2009. The effects of size and reproductive quality on the outcomes of duels between honey bee queens (Apis mellifera L.). Ethol. Ecol. Evol. 21, 147–153. https://doi.org/10.1080/08927014.2009.9522503
Tautz, J., Lindauer, M., 1997. Honeybees establish specific sites on the comb for their waggle dances. J. Comp. Physiol. [A] 180, 537–539. https://doi.org/10.1007/s003590050070
Xu, Y., Singh, R.K., Thakur, C.S., Wang, R., van Schaik, A., 2016. CAR-FAC Model of the Cochlea on the FPGA, in: BioMedical Circuits and Systems Conference, BIOCAS 2016. IEEE, Kingswood, NSW, pp. 1–4.