

Quantifying the foraging activity of honey bee colonies is a desirable goal for both beekeepers and researchers1. Consequently, systems for automatically monitoring worker departures, returns, and loss rates have been widely utilised to assess colony health and productivity2. Notably however, the hardware associated with these systems can restrict colony entrances, and generally lacks the ability to extract detailed information relating to pollen intake or forager behaviour. To address this, we have developed a novel AI-based system for monitoring foraging activity via a remote camera setup, leveraging automated bee recognition, tracking, and pollen detection to collect rich data without the need for intrusive hardware.
To demonstrate the utility of this approach, we outline the development, performance, and validation of the system, along with its successful usage. Further, we detail the integration of a simple user interface for rapid and flexible deployment and data analysis. This pipeline aims to provide beekeepers with an accessible means to measure colony productivity, while benefitting research applications across a broad range of scenarios. To maximise accessibility, associated software will be made available as a free and open-source package for immediate usage and further development.
Aims and objectives
The principle aim of this work was to develop an AI-based system for monitoring the foraging activity of honey bee colonies in the field. This comprised i) training a deep learning model to automatically detect bees and determine if they carried pollen; ii) integrating a tracking algorithm to individually track detected bees across frames and generate trajectories; iii) building a pipeline to ascertain when these trajectories entered or exited a colony; and iv) incorporating the combined system into an accessible user interface for deployment.
In addition to these central objectives, we aimed to ensure that the system had the flexibility to run on a variety of devices, including desktop computers, laptops, and Raspberry Pi processors for edge deployment. Further, we endeavoured to keep the hardware elements as inexpensive as possible, ideally well below that of commercially available bee counters—these costing £135-£500—while making the software accessible and free to use.
Methodology
System development was broadly divided into the tasks of data collection, model training and testing, and pipeline integration. Each step was conducted iteratively, with model performance informing the collection of additional training data as needed.
To collect an initial image dataset for model training, videos were sampled from 50 honey bee colonies situated at apiaries in Devon and Cornwall. Recordings utilised a camera and gooseneck monopod to film colony entrances, with the aim of capturing videos across a range of representative lighting and weather conditions (Fig. 1a). Frames were then extracted from videos, and bees were annotated to distinguish between those with and without pollen, providing varied examples of each for model training. This yielded a total of >45,000 individual honey bee annotations, made possible by a combination of manual and AI-assisted labelling (Fig. 1b-e). Images were thereafter divided into subsets to be used for model training and testing, with each group containing a mutually-exclusive set of colonies.
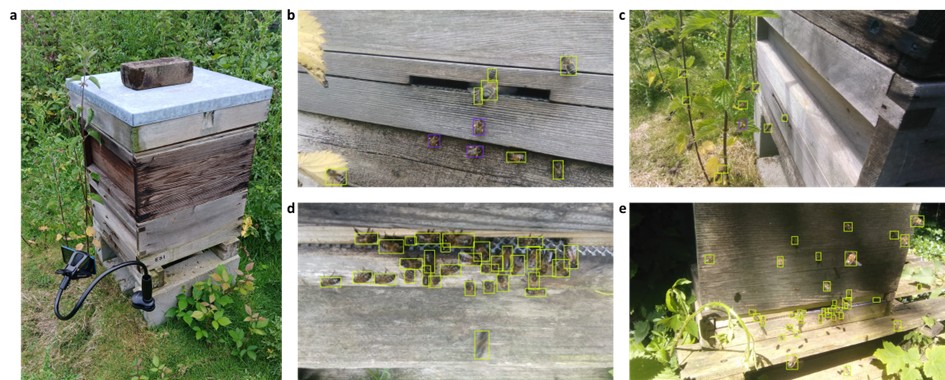
Figure 1. a) Data collection setup. The same standardised camera system was utilised for both data sampling and system deployment. b-e) Example annotations from the training dataset featuring colonies located in Cornwall and Devon. Green bounding boxes indicate bees without pollen, while purple bounding boxes denote those carrying pollen.
The annotated dataset was subsequently utilised to train a detection model based upon the YOLO113 deep learning architecture, selected for its balance of speed and accuracy. This was refined until an F1 score—a measure of mean model accuracy between 0 to 1—of ≥0.75 was achieved, indicating robust performance across colonies (Fig. 2a). To link detections between frames and generate individual tracks, a bespoke implementation of the ByteTrack4 algorithm was then integrated with the model and tested to optimise tracking fidelity. The resultant system was thus able to identify bees, determine if they carried pollen, and track their trajectories as they entered or exited colonies (Fig. 2b-e).
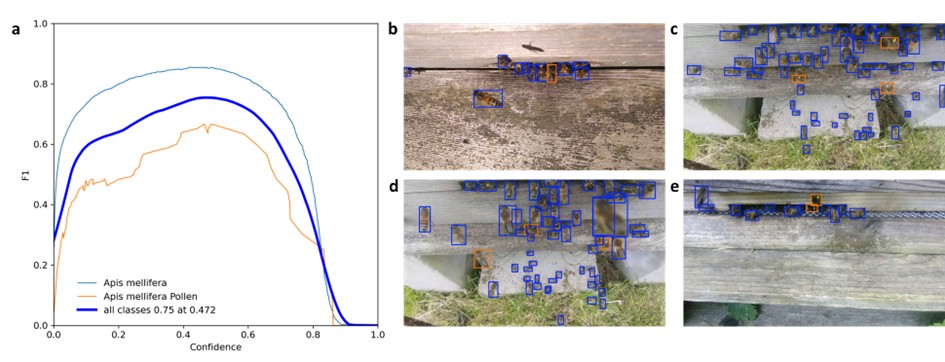
Figure 2. a) Model F1 confidence curve demonstrating mean accuracy when tested against unseen validation data. Line colours indicate values for bees with and without pollen (with pollen, orange; without pollen, blue). b-e) Example detections demonstrating model discrimination between bees with and without pollen. Bounding box colours indicate class (with pollen, orange; without pollen, blue).
Notably, to translate model outputs into meaningful foraging data, an additional step was needed to determine when tracked bees truly entered or exited colonies. To achieve this, we developed a simple geometry pipeline that enabled colony entrances to be designated visually, and bee trajectories classified by whether they entered or exited this region. Specifically, returning bees were identified by trajectories that began outside of the entrance and ended within, while departing bees were identified by trajectories that began within the entrance and ended outside (Fig. 3a-b). Crucially, this allowed discrimination between true entrances and exits, and instances where bees instead flew over the entrance, or left only to immediately renter. The combined pipeline thus recorded when entrances and exits occurred, whether associated bees were carrying pollen, and the coordinates and relative speeds of their trajectories (Fig. 3c-f).
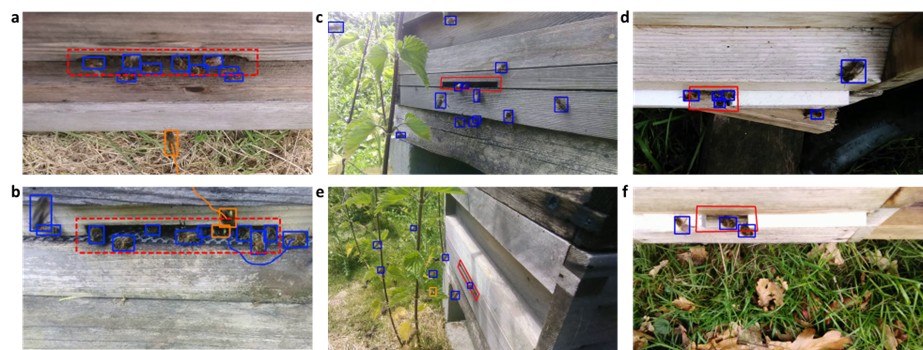
Figure 3. a-b) Example trajectories and entrance region designation. As bees frequently pass in front of the entrance, or walk over the surface of the hive without leaving, the tracking pipeline only records entrances as trajectories that originate outside the entrance region and end within; and exits as those that originate within, and end outside. c-f) Example entrance region geometries across various nucleus and full-size hives. Bounding box colours indicate class (with pollen, orange; without pollen, blue; entrance region, red).
Despite the utility of such data, it is difficult to parse in its raw form—consisting of tens or hundreds of thousands of events even for comparably short recordings. Consequently, we deemed it essential to develop a platform for collating and summarising the data into a digestible format for rapid colony assessment. To this end, we utilised the Dash5 framework to build an accessible and lightweight graphical user interface for system setup and data analysis (Fig. 4). This provided a simple interface for camera positioning and colony entrance designation (Fig 4a); and a data summary dashboard for viewing entrances, exits, net worker change, and pollen intake across a range of time scales (Fig 4b). Interface functionality was then tested with desktop, laptop, Apple, and Android devices to ensure responsiveness, and data outputs were validated manually across a selection of test videos.
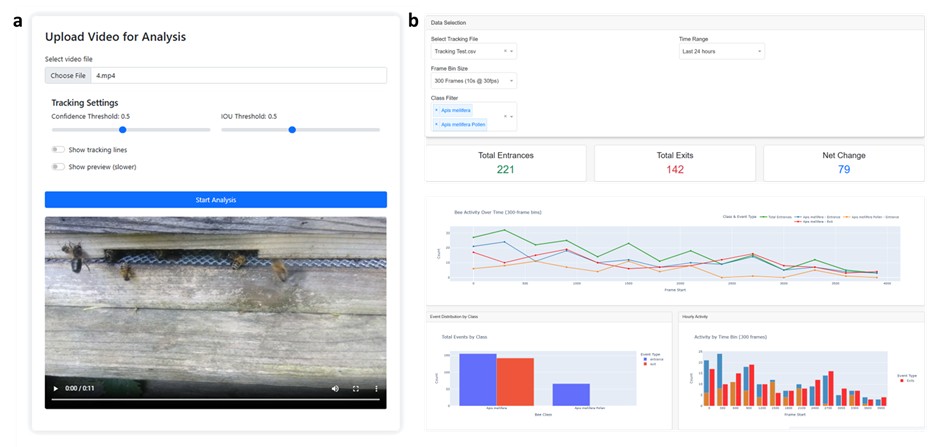
Figure 4. a) System setup interface. This allows users to select videos or streams for analysis, set model parameters, and designate the entrance region. b) Data analysis interface. A graphical overview provides users with a rapid and customisable summary of tracking outputs.
Outcomes
Project outcomes consist of three principle outputs—the extensive training image dataset, the honey bee detection and tracking algorithms, and the combined software package. We are in the process of preparing a public GitHub repository with user manuals for the release of these, along with an associated publication outlining system development in detail. As such, our primary objective is now to refine and finalise these resources for initial release and dissemination.
We envisage these outputs to be of utility to different user groups. The annotated training dataset provides a free resource for researchers aiming to develop or test their own models, and can be exported in any common data annotation format for accessibility across architectures. The honey bee detection model and tracking algorithm offer an immediately deployable Python pipeline for research applications and technical users wishing to modify the framework for their own specific use cases. Finally, the combined software package provides the full system functionality and user interface as a single installable distribution for applied colony monitoring.
To operate the monitoring system, users require a recording device; tripod or positioning attachment; and a desktop, laptop, or Raspberry Pi processor for deploying the software. While we have endeavoured to make the system as flexible as possible to allow for the use of existing hardware, the associated GitHub repository will provide full setup instructions and hardware specifications to facilitate maximum ease-of-use.
Conclusion
While initial operational capability has been achieved, it is our aim to utilise this system extensively in future research. Specifically, we hope to apply the framework to assess foraging activity in wild honey bee colonies, explore non-invasive correlates of colony health in beekeeping operations, and integrate associated monitoring capabilities into automated pollinator network analyses. In addition, we will leverage user feedback upon release of the system to further refine performance, add novel features, and streamline functionality in response to community requirements.
Role of ECT funding
This work would not have been possible without ECT funding. Our team has relied entirely on funds provided by the ECT for both salary and equipment costs, enabling the transition of our initial project idea into a functional system. Beyond the immediate results described here, this has generated substantial opportunities for downstream impact, as we intend to disseminate the system and utilise it extensively in our own research. Further, over the course of this project, we have been able to build novel links with a number of aligned researchers and beekeepers, each of which will facilitate expanded scope for future work.
Dr Thomas O’Shea-Wheller, University of Exeter.
Ref.: ECT_ 20240926A
Completed 2025
References
1. Meikle, W. G. & Holst, N. Application of continuous monitoring of honeybee colonies. Apidologie 46, 10–22 (2015).
2. Odemer, R. & Appl, A. Approaches, challenges and recent advances in automated bee counting devices: A review. Annals of Applied Biology 180, 73–89 (2022).
3. Khanam, R. & Hussain, M. Yolov11: An overview of the key architectural enhancements. arXiv preprint arXiv:2410.17725 (2024).
4. Zhang, Y. et al. Bytetrack: Multi-object tracking by associating every detection box. in European conference on computer vision 1–21 (2022).
5. Parmer, C., Duval, P. & Johnson, A. A data and analytics web app framework for Python, no JavaScript required. Preprint at https://doi.org/10.5281/zenodo.14182630 (2025).